Branch and department profit and loss
Compare how much each branch or department earns after its own costs, and see which contributes most to the business.

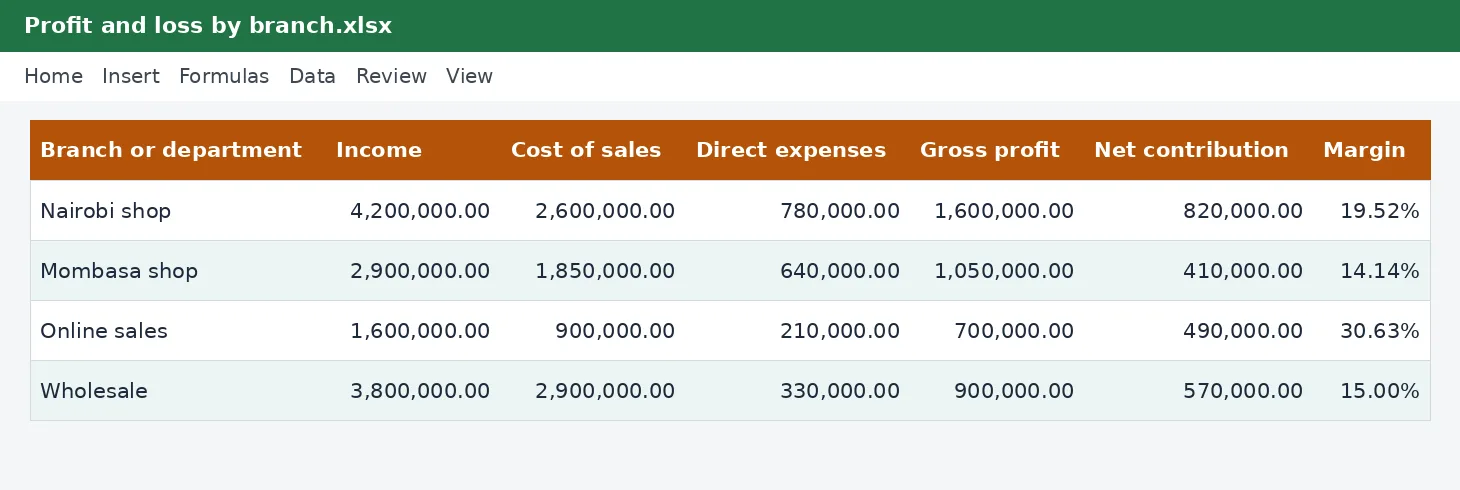
A business can be profitable overall while one branch loses money. List each branch or department with its income, cost of sales and direct expenses, and the workbook shows its gross profit, its net contribution and its margin, with a total for the business and a chart, so you know where to invest and where to act.
Owners and managers of businesses with several outlets, departments or product lines, and accountants preparing segment reports.
What is included
- Gross profit and net contribution for each unit
- Margin percentage
- Totals for the whole business
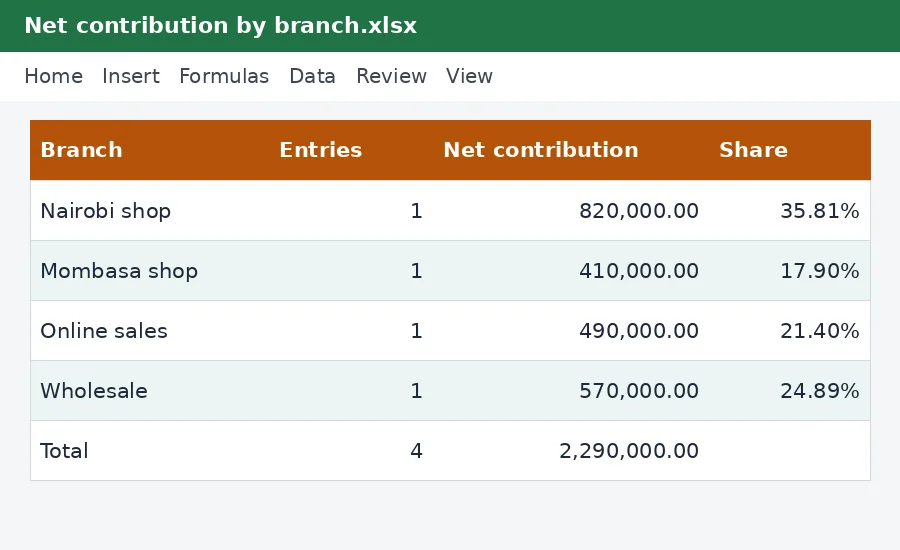
- Share of income by branch
- Chart of net contribution by branch
Advertisement
Screenshots
How to use it
- List each branch or department.
- Enter its income, cost of sales and direct expenses for the period.
- Read the gross profit, the net contribution and the margin.
- Compare the branches on the summary sheet and decide where to act.
Templates are tools to help with your own records. They are not tax or legal advice. Check the figures against official sources before filing or paying.
Advertisement
More in this category
-
 Accountingpdf
Credit control policy and collection letters
A credit policy and four collection letters, from a friendly reminder to a final demand, to get paid on time.
KES 810KES 900-10%
View details →
-
 Accountingpdf
Audit preparation guide for small businesses
How to prepare for an annual audit: documents, schedules, timeline and what the auditor will ask.
KES 900KES 1,000-10%
View details →
-
 Accountingpdf
Internal controls checklist for small businesses
A practical checklist of controls that protect a small business from error and fraud: cash, sales, purchases and payroll.
KES 720KES 800-10%
View details →
What the branch and department profit and loss does
A business can be profitable overall while one branch loses money. List each branch or department with its income, cost of sales and direct expenses, and the workbook shows its gross profit, its net contribution and its margin, with a total for the business and a chart, so you know where to invest and where to act.
Who it is for
Owners and managers of businesses with several outlets, departments or product lines, and accountants preparing segment reports.
How to use the workbook
- List each branch or department.
- Enter its income, cost of sales and direct expenses for the period.
- Read the gross profit, the net contribution and the margin.
- Compare the branches on the summary sheet and decide where to act.
- Save a copy under a new name for each month or year, so earlier records stay as they were.
What is inside
- Gross profit and net contribution for each unit
- Margin percentage
- Totals for the whole business
- Share of income by branch
- Chart of net contribution by branch
The workbook has these sheets: Instructions, Branches, By branch. The main table has the columns Branch or department; Income; Cost of sales; Direct expenses; Gross profit; Net contribution; Margin. Yellow cells are for you to fill in and grey cells calculate by themselves, so leave the grey cells alone. The example rows show how it works; type over them with your own entries.
Tips for getting it right
- Charge each branch only the costs it controls directly.
- Keep shared overheads separate so the comparison is fair.
- Use the same period and method for every branch.
- Review monthly and compare with the same period last year.
Why keep this record
Accounting records let you answer three questions at any time: what came in, what went out and who owes whom. Kept consistently they also make tax returns, loan applications and the sale of a business much easier, because the evidence is already organised. Entering transactions the day they happen is far cheaper than reconstructing them at year end.
Questions people ask
Do I need to know Excel formulas? No. Type into the yellow cells and the rest is worked out for you. The formulas are visible if you want to see how a figure is reached.
Can I add rows or change the layout? You can add your own columns to the right and your own notes. If you insert rows inside a table, copy the grey formula cells down so the new rows calculate too.
Will it work on my phone or in Google Sheets? Yes for viewing and typing, but dropdown lists and the charts look best in desktop Excel or LibreOffice.
Keeping it safe and up to date
Good accounting records are a legal duty as well as a management tool: keep the supporting receipts and invoices with the workbook, and keep each year's copy for at least five years. Work on a copy, never on your only file, and back it up.
Read how to keep business records for KRA for the wider picture. Free calculators that go with it: Corporation tax calculator. See more accounting templates or ask us for a custom one.
The workbook works in Microsoft Excel, LibreOffice and Google Sheets. It is a tool to help you work out and record figures, not tax, legal or accounting advice, and it is not affiliated with the Kenya Revenue Authority. If something does not work as described, contact us and we will put it right.
Related guides, calculators and templates
- Free calculator: Corporation Tax Calculator
- Guide: When to hire an accountant or tax agent, and what to expect
- Guide: Bookkeeping for small businesses in Kenya: how to get started
- Guide: Lease or buy: how to decide on equipment and vehicles
- Another template: Monthly profit and loss statement
- Another template: Year-end closing checklist and adjustments
- Another template: Accounts payable ageing schedule
Need something different? Request a custom template, browse all guides or see every Excel template.
Scroll inside the box to read more.