Monthly sales tracker with targets
Record the units you sell of each product each month, see the revenue, and compare it with your target with a chart.

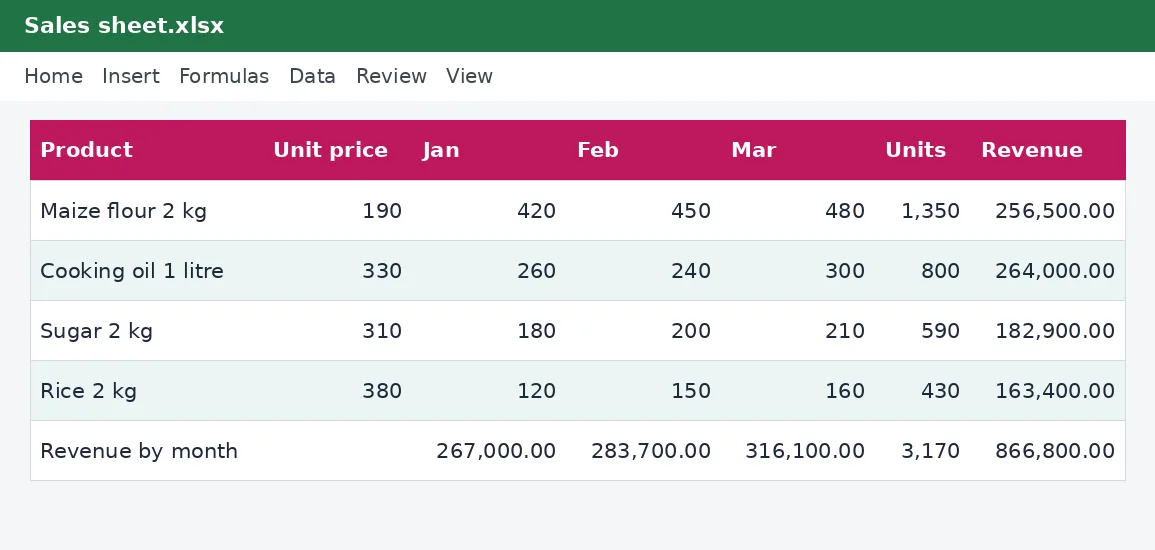
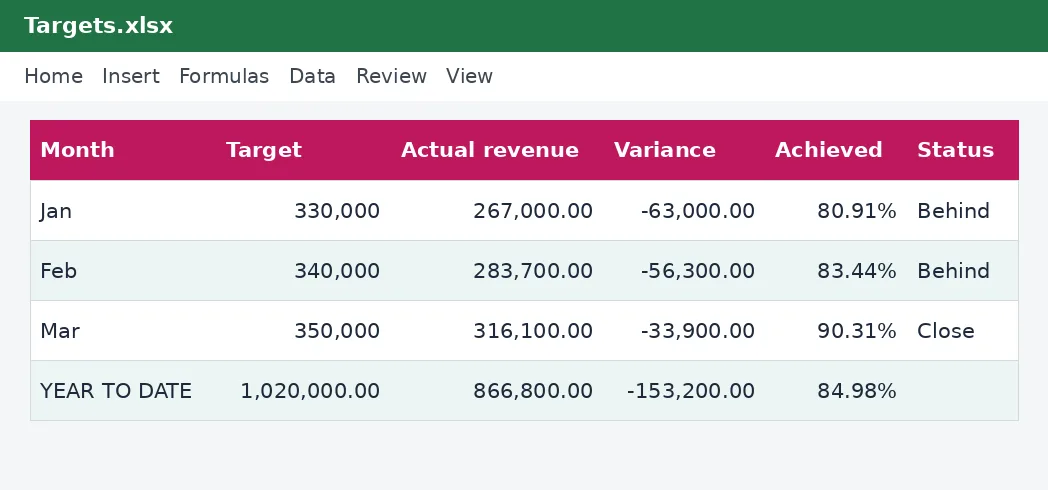
Set a target, record what you sell and see straight away whether you are on track. List your products with their prices, type the units sold each month, and the tracker works out the revenue by product and by month, compares each month with your target, shows how close you came and names your best-selling product. A chart puts target and actual side by side.
What is included
- Up to 20 products
- Units and revenue by month
- Monthly target, variance and achievement
- Target met, close or behind status
- Chart of target and actual
Advertisement
Screenshots
How to use it
- List products and prices.
- Enter units sold each month.
- Enter your monthly targets.
- Read the status and the chart.
Templates are tools to help with your own records. They are not tax or legal advice. Check the figures against official sources before filing or paying.
Advertisement
More in this category
-
 Businesspdf
Small business funding guide for Kenya
The main ways Kenyan small businesses raise money: savings, loans, SACCOs, mobile lenders, grants and investors.
KES 720KES 800-10%
View details →
-
 Businesspdf
SOP writing guide and templates
How to write standard operating procedures that people actually use, with templates for a process, a checklist and a training record.
KES 810KES 900-10%
View details →
-
 Businesspdf
Sales proposal and quotation pack
Win more work with a clear proposal, a professional quotation and a follow-up letter, with a checklist for each step.
KES 630KES 700-10%
View details →
If you do not measure sales, you are guessing
Ask a shopkeeper how sales are going and you will usually hear "so-so" or "better than last month". Ask for the figure and the answer takes an hour to find. A business that cannot say, at the end of any month, what it sold, of what, and against what goal, is flying blind. A sales tracker takes ten minutes a day and turns "so-so" into numbers you can act on. This free workbook records the units sold of each product, works out the revenue, and sets it against a monthly target, with a chart.
How the tracker is built
There are two sheets. On the Sales sheet you list up to twenty products with their selling price, and type the number of units sold each month. For each product the sheet adds up the year's units and the revenue, and across the bottom it shows the revenue for each month. On the Targets sheet you enter the sales target for each month. The sheet takes the actual revenue from the Sales sheet and shows the variance, the share of the target achieved and a status: Target met, Close if you are above ninety per cent, Behind, or No sales yet. It also names your best-selling product by revenue, and a column chart puts the target and the actual side by side.
- Units and revenue for every product and every month.
- Monthly revenue totals and a year total.
- Target, variance, percentage achieved and status for each month.
- Best-selling product by revenue.
Setting a target that means something
A target is useful when it is specific, achievable and connected to your costs. Start from the break-even point: how much must you sell each month to cover your costs? Our break-even and pricing calculator in this collection works that out. Then add the profit you want. Compare it with last year's same month, adjusted for any growth you can explain, and be honest about seasonality: in many businesses December is double an average month and February is half. The example in the workbook raises the target a little every month, but your own targets should follow your own pattern.
Reading the results
A month marked Behind is a question, not a verdict. Look at which products fell short. Was it a price change, a stock-out, a competitor or the weather? Look at the best sellers too: if one product brings most of your revenue, your business depends on it, and a stock-out of that item hurts more than anything else. The unit figures also help you plan purchases, because last year's units in the same month are the best guide to what to order.
A simple daily and monthly routine
- At the end of each day, or each week, record the units sold for each product from your till, sales book or M-Pesa messages.
- At month-end, check that the units add up and that the revenue agrees with the money you banked.
- Read the status and the chart. Write down one thing you will do differently next month.
- Save a copy of the workbook for the year, and start a new one for the next.
Sales and tax
Your sales figures are the starting point for several tax obligations. If you pay turnover tax, the monthly total is the figure the tax is charged on, and our turnover tax tracker uses it. If you are registered for VAT, the sales figures feed the return, and the VAT return working sheet organises them. Sales records are also the evidence behind your income tax return, so keep them for at least five years. Where you are required to issue electronic tax invoices, those invoices and your tracker should agree, and our guide to eTIMS e-invoicing explains the requirement. Our turnover tax calculator shows the tax on any month's sales.
This workbook is a record-keeping and planning tool and not financial or tax advice. The sample products and targets are illustrations. For tax matters, see the Kenya Revenue Authority or ask your accountant.
Related guides, calculators and templates
- Guide: How to build a 12-month cash flow forecast for a small business
- Guide: How to price your products and services: markup, margin and break-even
- Guide: Turnover tax for small businesses in Kenya: rate, limits and when to use it
- Another template: 12-month cash flow forecast
- Another template: Break-even and pricing calculator
- Another template: Budget versus actual tracker
Need something different? Request a custom template, browse all guides or see every Excel template.
Scroll inside the box to read more.