Rental property investment analyser
Compare rental properties by total cost, rent, expenses, yield and years to pay back, before you buy.

A property is a good investment only if the numbers work. List each property with its price and buying costs, the yearly rent and running costs, and the analyser works out the total invested, the net income, the gross and net yield and the years it takes the rent to pay back the money, so you can compare properties and decide.
Investors, landlords and advisers comparing properties to buy, and anyone checking whether an existing rental is performing.
What is included
- Total invested including buying costs
- Net rental income after costs
- Gross yield and net yield
- Years to pay back the investment
- Totals for a portfolio
Advertisement
Screenshots
How to use it
- List each property with its purchase price and the buying costs such as stamp duty, legal fees and agent fees.
- Enter the expected yearly rent and the yearly running costs.
- Read the gross yield, net yield and payback period.
- Compare properties side by side and adjust the assumptions.
Templates are tools to help with your own records. They are not tax or legal advice. Check the figures against official sources before filing or paying.
Advertisement
More in this category
-
 Businesspdf
Small business funding guide for Kenya
The main ways Kenyan small businesses raise money: savings, loans, SACCOs, mobile lenders, grants and investors.
KES 720KES 800-10%
View details →
-
 Businesspdf
SOP writing guide and templates
How to write standard operating procedures that people actually use, with templates for a process, a checklist and a training record.
KES 810KES 900-10%
View details →
-
 Businesspdf
Sales proposal and quotation pack
Win more work with a clear proposal, a professional quotation and a follow-up letter, with a checklist for each step.
KES 630KES 700-10%
View details →
What the rental property investment analyser does
A property is a good investment only if the numbers work. List each property with its price and buying costs, the yearly rent and running costs, and the analyser works out the total invested, the net income, the gross and net yield and the years it takes the rent to pay back the money, so you can compare properties and decide.
Who it is for
Investors, landlords and advisers comparing properties to buy, and anyone checking whether an existing rental is performing.
How to use the workbook
- List each property with its purchase price and the buying costs such as stamp duty, legal fees and agent fees.
- Enter the expected yearly rent and the yearly running costs.
- Read the gross yield, net yield and payback period.
- Compare properties side by side and adjust the assumptions.
- Save a copy under a new name for each month or year, so earlier records stay as they were.
What is inside
- Total invested including buying costs
- Net rental income after costs
- Gross yield and net yield
- Years to pay back the investment
- Totals for a portfolio
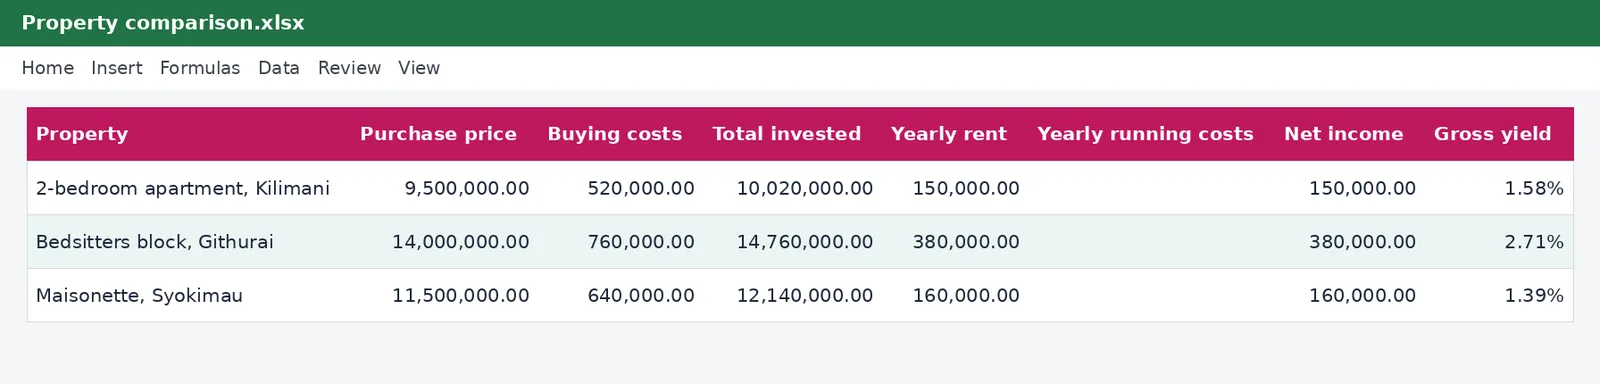
The workbook has these sheets: Instructions, Properties. The main table has the columns Property; Purchase price; Buying costs; Total invested; Yearly rent; Yearly running costs; Net income; Gross yield. Yellow cells are for you to fill in and grey cells calculate by themselves, so leave the grey cells alone. The example rows show how it works; type over them with your own entries.
Tips for getting it right
- Allow for vacant months in the yearly rent.
- Include repairs, management fees, rates and insurance in the running costs.
- Remember that tax on rent reduces the real return.
- Compare yields with what you could earn elsewhere with less risk.
Why keep this record
Running a business on memory works until it grows. Writing the numbers down turns opinions into facts you can compare month to month, and shows early which products, customers or costs deserve attention. Even a simple workbook, used every week, usually beats a sophisticated one that is opened once a year.
Questions people ask
Do I need to know Excel formulas? No. Type into the yellow cells and the rest is worked out for you. The formulas are visible if you want to see how a figure is reached.
Can I add rows or change the layout? You can add your own columns to the right and your own notes. If you insert rows inside a table, copy the grey formula cells down so the new rows calculate too.
Will it work on my phone or in Google Sheets? Yes for viewing and typing, but dropdown lists and the charts look best in desktop Excel or LibreOffice.
Keeping it safe and up to date
A plan is only as good as the numbers you put in. Start with honest estimates, update the workbook as real figures arrive, and compare the two so your next estimate is better. Save a dated copy each month so you can see how your thinking changed.
Read how to build a cash flow forecast for the wider picture. Free calculators that go with it: Rental income tax calculator, Capital gains tax calculator. See more business templates or ask us for a custom one.
The workbook works in Microsoft Excel, LibreOffice and Google Sheets. It is a tool to help you work out and record figures, not tax, legal or accounting advice, and it is not affiliated with the Kenya Revenue Authority. If something does not work as described, contact us and we will put it right.
Related guides, calculators and templates
- Free calculator: Rental Income Tax Calculator
- Free calculator: Capital Gains Tax Calculator
- Guide: Monthly rental income tax or annual tax: which route is better for a landlord?
- Guide: The 30 June tax deadline
- Guide: How to file a Monthly Rental Income return
- Another template: 12-month cash flow forecast
- Another template: Break-even and pricing calculator
- Another template: Budget versus actual tracker
Need something different? Request a custom template, browse all guides or see every Excel template.
Scroll inside the box to read more.