Sales pipeline and lead tracker
Track every opportunity from lead to won or lost, with weighted values, next actions and a forecast of what you will close.

Sales are lost in the gap between 'I will follow up' and actually following up. This tracker lists every opportunity with its company, value, stage, expected close date and next action. It weights each by the chance of winning at its stage, flags actions that are overdue, and summarises the pipeline by stage, your win rate, your average deal and what you expect to close this month.
What is included
- Up to 200 opportunities
- Stages with win probabilities you can change
- Weighted pipeline value
- Next action, due date and overdue flag
- Win rate, average deal and monthly forecast
Advertisement
Screenshots
How to use it
- Check stage probabilities on the Rates sheet.
- Add each opportunity with stage and value.
- Set a next action and date.
- Review the Summary each week.
Rates and thresholds
Edit the win probabilities on the Rates sheet.
Templates are tools to help with your own records. They are not tax or legal advice. Check the figures against official sources before filing or paying.
Advertisement
More in this category
-
 Businesspdf
Small business funding guide for Kenya
The main ways Kenyan small businesses raise money: savings, loans, SACCOs, mobile lenders, grants and investors.
KES 720KES 800-10%
View details →
-
 Businesspdf
SOP writing guide and templates
How to write standard operating procedures that people actually use, with templates for a process, a checklist and a training record.
KES 810KES 900-10%
View details →
-
 Businesspdf
Sales proposal and quotation pack
Win more work with a clear proposal, a professional quotation and a follow-up letter, with a checklist for each step.
KES 630KES 700-10%
View details →
Most sales are not lost. They are forgotten.
Someone asks for a quotation on Monday. You send it on Tuesday. You mean to call on Friday, then the week gets busy, and by the time you remember, they have bought from someone else. This happens in every business that sells to customers one at a time, from a consultant with six clients to a supplier with sixty. A pipeline tracker is simply a list of everyone who might buy, where they are in the process, and what you are going to do next. This workbook keeps it, weights it by the chance of winning, and nags you when an action is overdue.
What the pipeline records
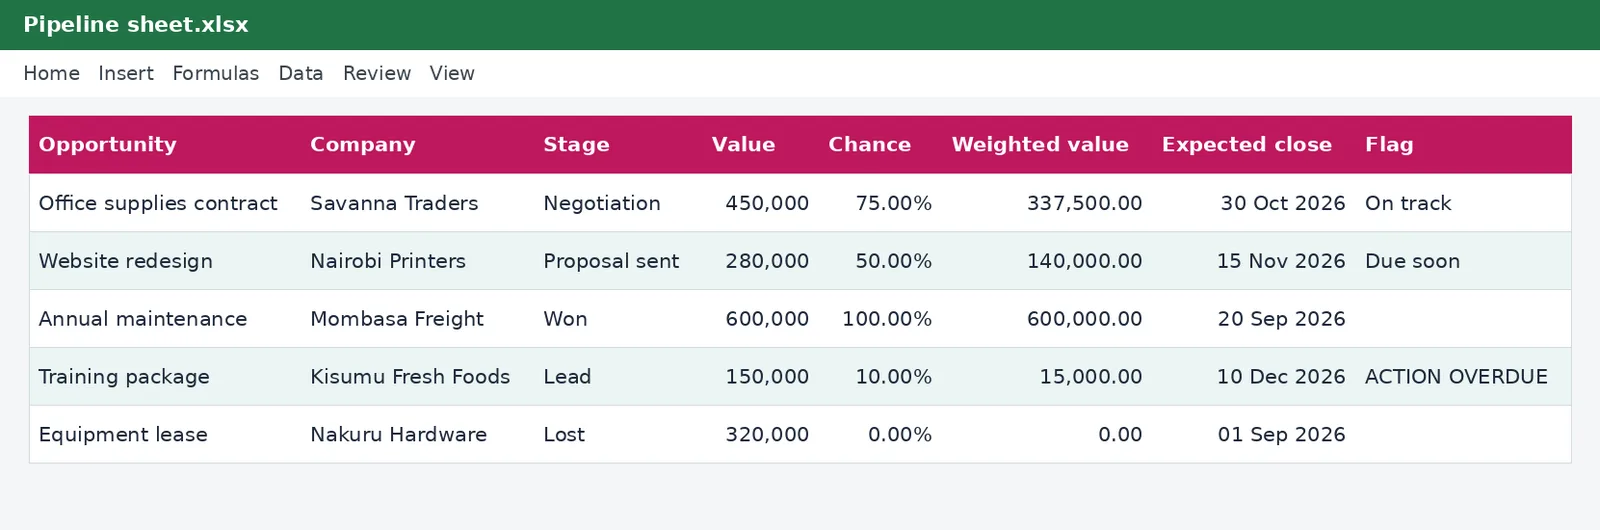
Each row on the Pipeline sheet is an opportunity: the name of the deal, the company and contact, where the lead came from, the stage it has reached, its value, the date you expect to close it, who owns it, the next action and the date it is due. From these the workbook works out the chance of winning, the weighted value, the days left until the next action and a flag.
- Stage: Lead, Contacted, Proposal sent, Negotiation, Won or Lost, chosen from a list.
- Chance of winning: set for each stage on the Rates sheet, so that you can adjust it to your own experience.
- Weighted value: the deal's value multiplied by the chance, a realistic view of what the pipeline is worth.
- Flag: No next action, ACTION OVERDUE in red, Due soon or On track.
The summary sheet
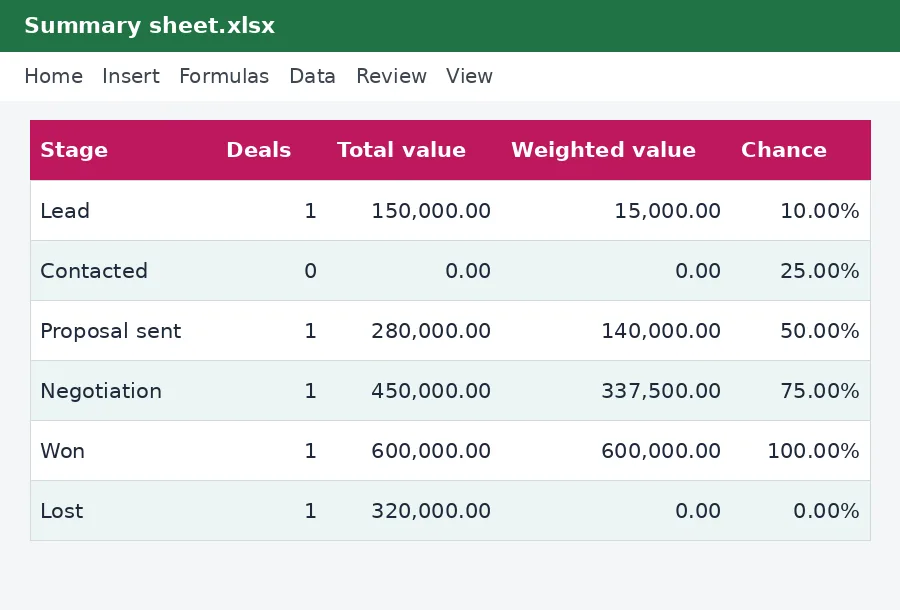
The Summary sheet answers the questions a sales manager asks. How many deals are at each stage, and what are they worth, in total and weighted? What is the open pipeline? What is our win rate, which is won divided by won plus lost? What is the average deal we win? How much do we expect to close this month, weighted by probability? How many actions are overdue? A chart compares the total and the weighted value at each stage.
Why weighting matters
A pipeline of one million shillings sounds wonderful until you remember that most of it is leads that may never come to anything. Weighting by stage makes it honest. A lead has perhaps a ten per cent chance and a deal in negotiation seventy-five. The weighted total is a much better guide to next month's income, and when you compare it with what you actually closed, you can improve the percentages.
A weekly sales routine
- Add every new enquiry the day it arrives, with a next action and a date.
- Update the stage of every deal that has moved.
- Filter the Flag column for ACTION OVERDUE and deal with those first.
- Look at the Summary sheet: is the open pipeline big enough to hit this month's and next month's targets?
- Move finished deals to Won or Lost, and note why, because the reasons for losing are the best training you will get.
Using it to forecast and plan
If your weighted pipeline for next month is well below your target, you need more leads now, not in three weeks. If your win rate is low, look at the proposals you send and the prices you quote: the pricing calculator in this collection can help. If deals stall at a particular stage, that stage is where your process needs work. Put the expected sales into your cash flow forecast, remembering that a sale is not cash until the customer pays, which the aged receivables tracker follows.
Taxes and customers
When a deal is won, remember what you must issue and record: a tax invoice, which may need to be an electronic one, as our guide to eTIMS e-invoicing explains, and VAT if you are registered, which the VAT calculator works out. Your sales also feed your turnover tax or VAT returns and the income tax return, so keep the quotation, the order and the invoice together for at least five years.
Looking after contact data
A pipeline holds personal data about the people you sell to. Kenya's Data Protection Act 2019 expects you to collect only what you need, keep it safe and delete it when you no longer need it. Keep the file on a protected device, do not share it widely and do not use contacts for marketing they did not agree to.
This workbook is a sales management tool and not legal, financial or tax advice. The example opportunities and probabilities are illustrations: replace them with your own experience. For tax obligations, see the Kenya Revenue Authority or ask your accountant.
Related guides, calculators and templates
- Guide: How to build a 12-month cash flow forecast for a small business
- Guide: How to price your products and services: markup, margin and break-even
- Guide: Turnover tax for small businesses in Kenya: rate, limits and when to use it
- Another template: 12-month cash flow forecast
- Another template: Break-even and pricing calculator
- Another template: Budget versus actual tracker
Need something different? Request a custom template, browse all guides or see every Excel template.
Scroll inside the box to read more.